
Demo house energy figures for the first calendar year By Chris Newman January 2nd, 2014
A new year starts and we’ve got our first full calendar year of demo house energy figures. We’re really happy with the performance of our (demo) house – its not often you hear someone say that about their home. Despite the figures still being pulled down by the very cold January to March 2013 with a house that wasn’t finished, our annual figures are as:
- Gas: 8187 kWh
- Electricity imported: 2271 kWh
- Electricity generated: 2035 kWh
What do I mean dragged down? Well a comparison of the June to end December figures for 2012 and 2013 show that in the former we used 3774 kWh gas and this year we used 1971 kWh. The difference is largely due to the house not being finished in the earlier year. We’re hoping to see a similar drop in the Jan-April figures in 2014 so that the April 2013 to March 2014 first full completed house figures will be super low.
In the meantime, an annual energy use of just over 8,000 kWh for a three storey, 4 bedroom partially attached Victorian house with 24 hour occupancy is not bad at all – perhaps it will get us an award this year!
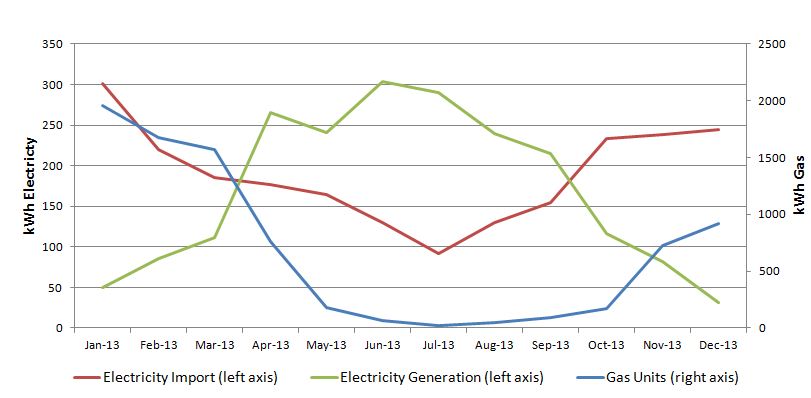
The first chart shows our energy use per month and you can see the marked difference between December 2013 and January 2013. The generation figures should have bottomed out and we should start to see it rising in January and February.
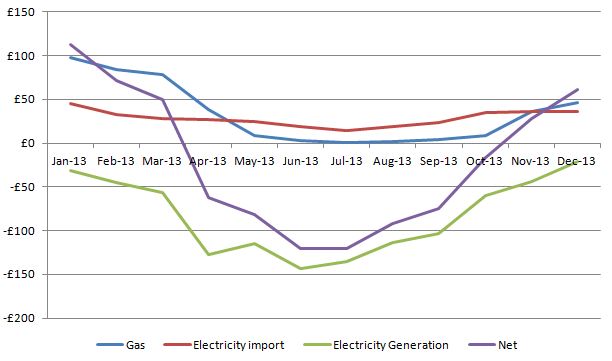
The next chart shows how much the house is costing us. All in all December is looking at around £60 – luckily I’ve got a credit in my Ecotricity account from the Feed In Tariff payments.
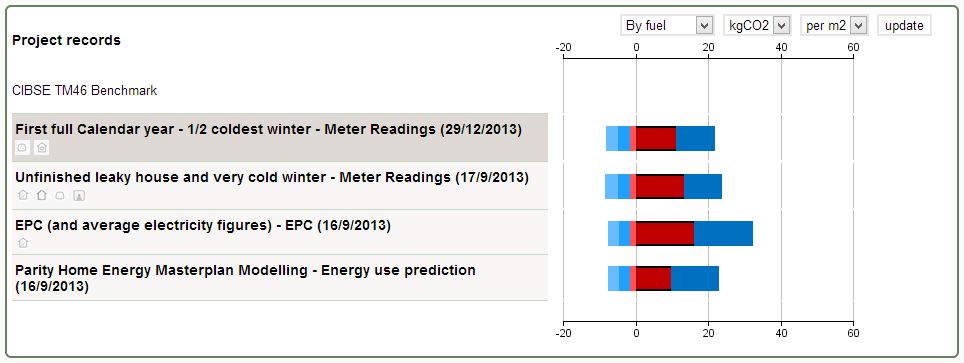
I’ve also updated my figures on CarbonBuzz and the Low Energy Building Database. This is where we can actually compare how we are doing to how the house should be doing.
CarbonBuzz
The first thing to notice is that our overall kgCO2 are very similar to what we modelled they would be using our Home Energy Masterplan – they are actually 18.4kgCO2/m2/year.
Low Carbon Building Database
Again we are pretty close to the Forecast figures too:
Primary Energy requirement (kWh/m2.year):
Forecast: 96 Actual: 91 [AECB Silver/Enerphit: 120]
Annual CO2 emissions (kgCO2/m2.year):
Forecast: 20 Actual: 18 [AECB Silver 22]

So what does all this show? Here’s our thoughts to start 2014:
1. Parity Projects modelling and design services are spot on for renovating a low energy home
2. Really big reductions can be achieved for a small marginal extra cost
3. People should be obsessed with cost effectiveness and not reaching a notional standard
4. We’re looking forward to another cosy year of negative bills in 2014